
Traffic over Putney, Kew and Chiswick Bridges has fallen since the closure of Hammersmith Bridge
New data has been released by Wandsworth council. Story 143

Welcome to Bridged2050: creating an even better Barnes during this climate crisis
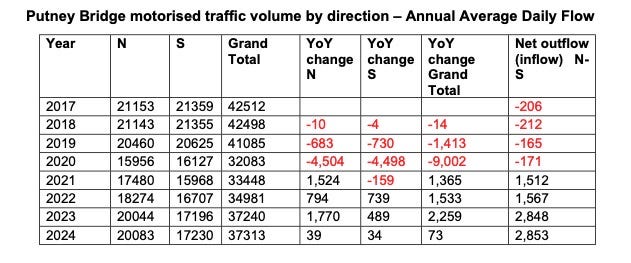
A report into Putney’s ‘million pound junction’ has revealed traffic levels on Putney Bridge in 2024 were lower than in 2018.
And the same is true for the other south west London bridges, too.
The council’s analysis draws on official counts from both the Department for Transport (DfT) and Transport for London (TfL). DfT data — summarised in the first table — shows that vehicle flows on Putney Bridge in 2024 sit below their 2018 levels.
A second table uses TfL figures to tell the bigger story, covering five crossings.

As the report notes,
Whilst there is some discrepancy between the DFT and TFL data for Putney Bridge and Wandsworth Bridge, the trends for both are consistent.
Traffic volume is lower across the Boat Race and Wandsworth Bridges in 2024 compared with 2018.
According to Putney News,
This suggests traffic displacement from the Hammersmith closure may be less significant than assumed.
It also suggests that some traffic has simply “evaporated”; people have changed their behaviour, switched modes, or abandoned journeys entirely.
Putney’s (£1m) real problem
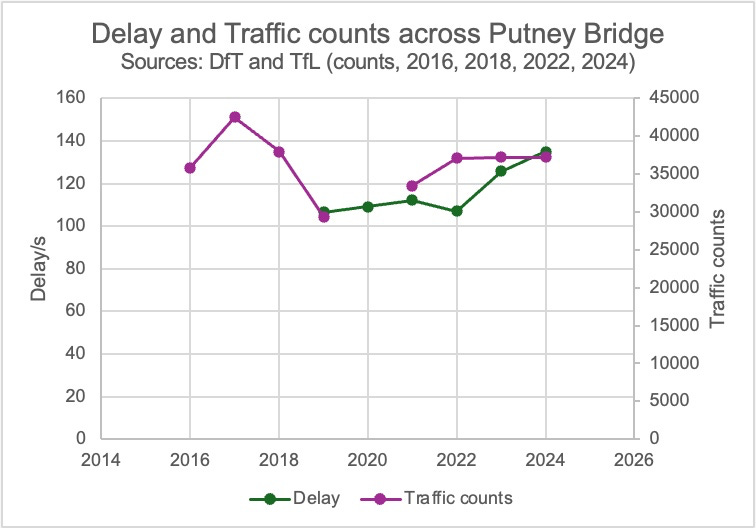
Despite this there are major delays especially on the Lower Richmond Road.
As Nick Maini explains in a separate report using different data,
Traffic [across Putney Bridge] initially fell back after the closure in 2019, but delays began to increase in 2023. That sequence of events suggests that there are other variables unrelated to the closure that are impacting travel times.
Putney News gets to the heart of issue for Putney residents and those passing through,
If fewer cars are using the bridge than before Hammersmith closed, why has congestion on the approach roads become so much worse?
The answer returns to the fundamental design choice: the junction was optimised for north-south traffic flow at the expense of east-west approaches. With Hammersmith Bridge open, those east-west approaches might have carried less traffic. With it closed indefinitely, they bear more load than the design can handle.

Notes & thoughts
This official data directly challenges a key claim made by those campaigning for the full restoration of Hammersmith Bridge — including MPs such as Sarah Olney and Fleur Anderson — that the closure has pushed intolerable levels of traffic onto neighbouring bridges. (You can download the paper here). Interesting to note, of the 70 case studies of roadspace reallocation from eleven countries, one was about … the closure of Hammersmith Bridge. 1997 the Bridged closed for one month.
The Bridge has had many impacts, but a surge in cross-river traffic at Putney, Kew or Chiswick isn’t one of them.
We should not have been surprised. The broader principle is well established: increase road capacity and traffic grows; reduce it and traffic falls. Urbanists call this ‘induced demand’ and its counterpart, ‘reduced demand’ or ‘traffic evaporation’.
There’s extensive research to support this insight. Hammersmithbridge.org.uk highlighted the work of Cairns, Atkins and Goodwin entitled ‘Disappearing traffic? The story so far’
None of this lets Wandsworth off the hook for a junction re-design that has left residents frustrated and journey times unpredictable. But blaming Hammersmith Bridge for Putney’s gridlock won’t survive contact with the data.
One other thing.
The Hammersmith Bridge Taskforce agreed to to share data - it was not clear whether they meant DfT and/or TfL - at its last known meeting. That was in March, 2025. Eight months ago and counting.
Bridged2050 wants fewer private vehicles on our roads, leaving them freer for emergency, public transport, taxies commercial vehicles and bikes.